(En anglais seulement) This tool allows for the computing and visualizing of the surface position (mm) and the interface position (mm) of a “Find Contact” curve (load or force vs. position) obtained from a needle probe measurement (Jurvelin et al., 1995) on a sample (Figure 1). This model is well adapted for the thickness measurement of samples composed of two layers (a soft layer on top and a stiffer layer under), for example: articular surfaces. This analysis can be used in two modes, either automatic or manual. In the automatic mode, the low-pass filter cutoff frequency and the loading limit need to be specified in order to optimize the interface detection for each different sample. A user license is required in order to obtain the results of the interfaces detection with needle probe (Software Add-On, contact Biomomentum to obtain your license).
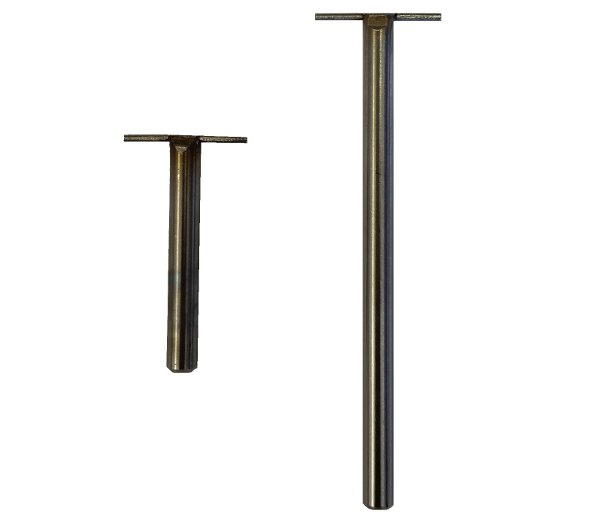
The needle probe measurement consists of moving the needle probe at a constant speed until it penetrates the surface of the sample and stops inside the interface. The difference between the position of the surface (position where the load starts to increase) and the position of the interface (sharp increase in the load) corresponds to the vertical thickness (Figure 2).
This analysis can be done in two modes, either automatic or manual. The automatic mode allows finding the surface (1) and the interface (2) position through an algorithm.
- In order to find the surface position (1), the algorithm will start from the maximum load and will slowly scan the curve until the load will be equal to the load at the starting point (Figure 3).
- In order to find the interface position (2), the algorithm will first smooth the curve with a low-pass filter (red line) and will then compute the first derivative (green line) and second derivative (blue line) of the curve. The position of the maxima of the second derivative will be considered as the interface position if its position is located before the user-defined loading limit (Figure 4).
Thus, the automatic mode consists of specifying two parameters:
Low-Pass Filter Cutoff Frequency (Hz) – Defines the cutoff frequency of the low-pass filter that will smooth the curve
Loading Limit (load/sec) – The inflection position is located before this loading limit defined by the user. This loading limit varies depending on the sample used; it represents the loading limit at which the user is certain that the needle probe is in the interface.
The manual mode lets the user drag the cursors to the surface the interface positions.
For example, (Figure 5) shows parameters used for the “Find Contact” function in needle probe measurement testing protocol on ovine articular surfaces. Corresponding results are shown in (Figure 1).
Mach-1 Analysis – Détection d’interfaces avec sonde à aiguille – Paramètres
Mach-1 Analysis -Détection d’interfaces avec sonde à aiguille -Mesure d’aiguille
Mach-1 Analysis -Détection d’interfaces avec sonde d’aiguile -Interface Position
Mach-1 Analysis -Détection d’interfaces avec sonde d’aiguille – Position Surface
Mach-1 Analysis – Interfaces Detection with Needle Probe – Example