Aller au contenu

Support d’échantillon, mords pour essais en tension (2 ensembles) et plaque de montage

MA090

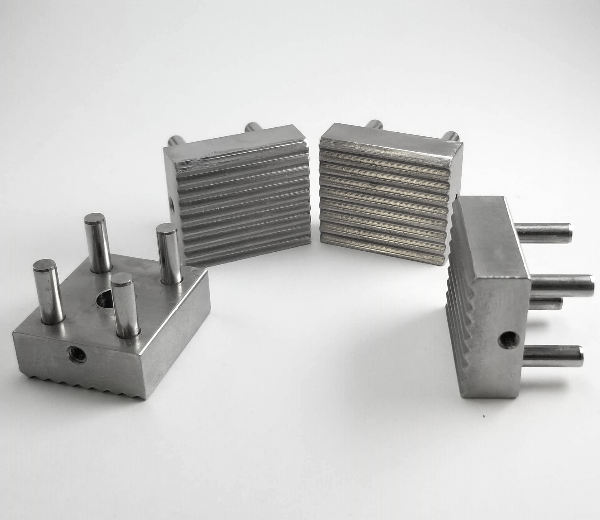
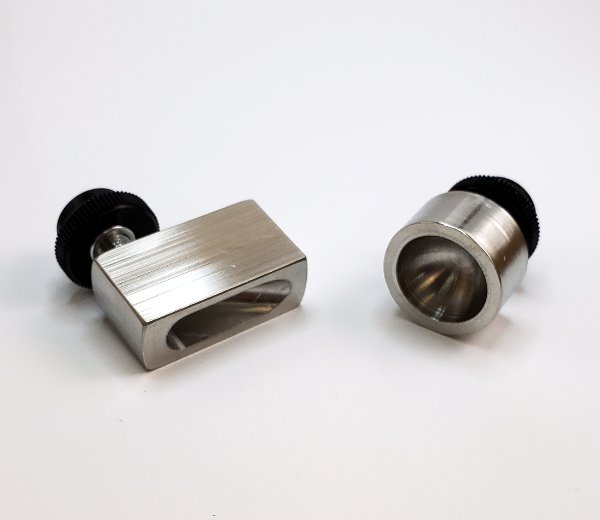
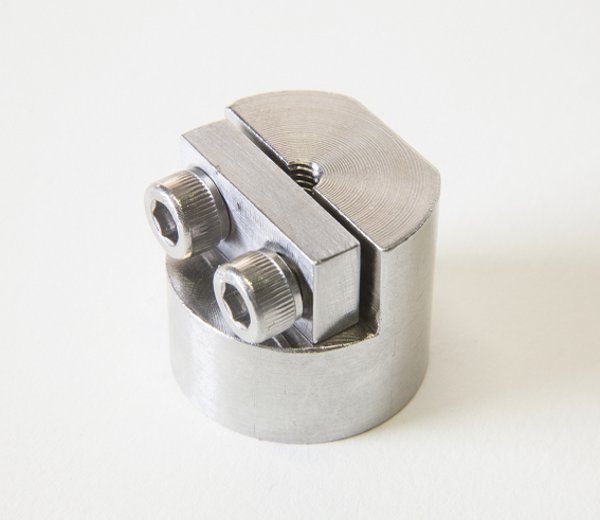
Deux paires de mords pour essai en traction et plaque de montage permettant de fixer l’échantillon

UGS : MA090 Catégories: ,

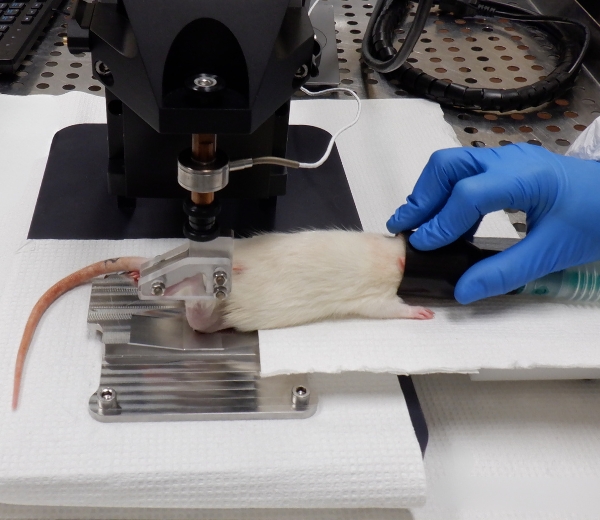
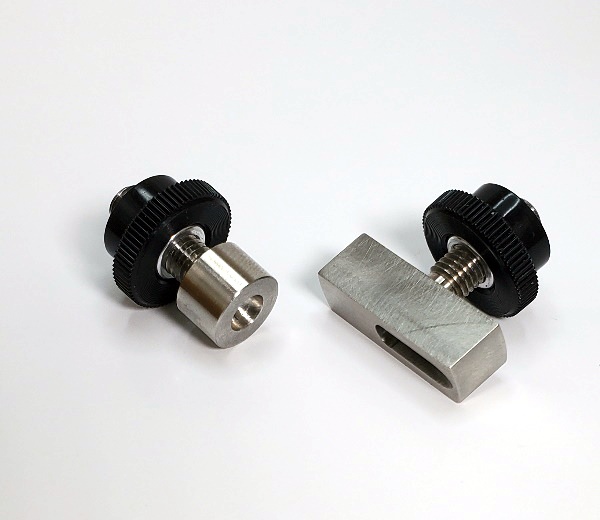
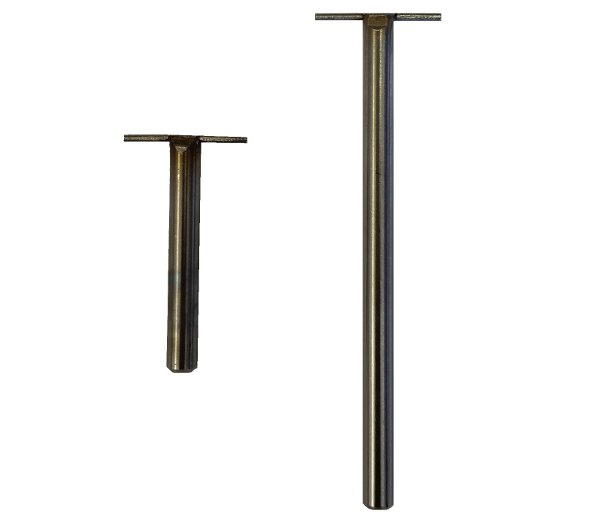
(En anglais seulement) These grips were designed for tension testing of soft sheet material. Their C-shaped cavities, coupled with the screwed stainless steel bar, solidly lock the sample in the grip. This set includes 4 grips (2 sets of 2) and the mounting plate allowing for an easy fixing of the sample.

  • Cet accessoire a été conçu pour faciliter son nettoyage et sa désinfection.
  • Cet accessoire présente un design robuste procurant une longue durabilité
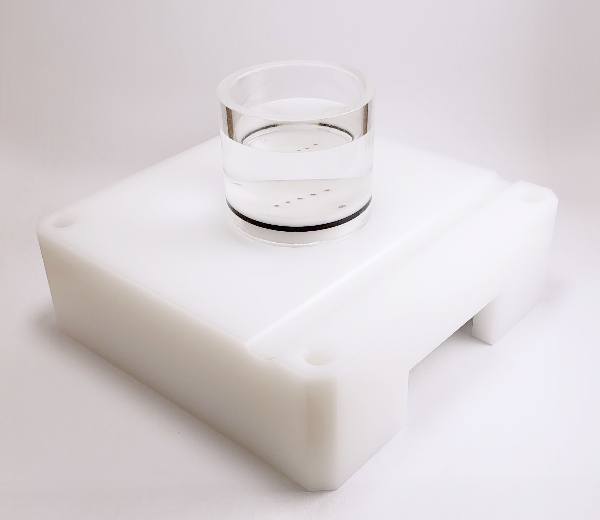
  • Compatible avec une utilisation en solution physiologique saline.
  • Facile à assembler et à monter sur le testeur
Matériaux

Acier inoxidable 316L

Largeur

25 mm (largeur max maintien de l’échantillon)

Diamètre

1/4 po (6.35 mm) Cylindre

Espacement

21.4 to 91.4 mm (ajustable saut de 10 mm) (longueur d’échantillon entre les serres)

Épaisseur

8 mm (max échantillon)

Fixation du bas

1/4-28 filet male

Fixation du haut

1/4-28 filet male

Configurations de test (4)

FAQ

Comment fonctionne le modèle "Sinusoid"?

(En anglais seulement) This feature is used to obtain the Frequency, Amplitude and Offset of a sinusoidal signal. A blue line displays the theoretical sinusoid with the Frequency, Amplitude and Offset obtained (Figure 1). The values of the Frequency, Amplitude and Offset are indicated in the "Results" field. The units vary according to the graph’s axes.

This feature can also be used for sinusoidal stimulus-response analysis. Sinusoidal stimulus shall be selected on the x-axis and the sinusoidal response on the y-axis. The Modulus is the ratio of the response Amplitude over the stimulus Amplitude. The Phase is the phase difference between the response and the stimulus. The Modulus’ is computed as the Modulus*Cos(Phase) and the Modulus” is computed as the Modulus*Sin(Phase). A blue line displays the theoretical sinusoidal stimulus-response with the Frequency, Modulus and Phase obtained (Figure 2). The values of the Modulus and Phase are indicated in the “Results” field. The units vary according to the graph’s axes.

One use for this feature would be to compute material properties by multiplying the Modulus obtained by the appropriate geometric factors. For example, the Young’s Modulus can be obtained during uniaxial compression or tension on cylindrical sample with t/pi*r2 as the geometric factor, t is the thickness and r is the radius of the sample.

Mach-1 Analysis – Sinusoid – Exemple d’analyse stimulus-réponse

Mach-1 Analysis – Sinusoid – Exemple d’analyse des signaux

Besoin d’aide pour choisir un accessoire ?

Parlez à notre équipe

Report a problem with this page

Your email is used only to follow up on this report.

Screenshots (optional)

Click this area and paste a screenshot, or drag files here. Up to 3 PNG, JPEG or WebP images; 5 MB per image. Hide confidential information first.

Please do not include passwords or customer information. Reports and screenshots are private.