Skip to content

Sample Holder, Tensile Grip (2 Sets) with Sample-Mounting Plate

MA090

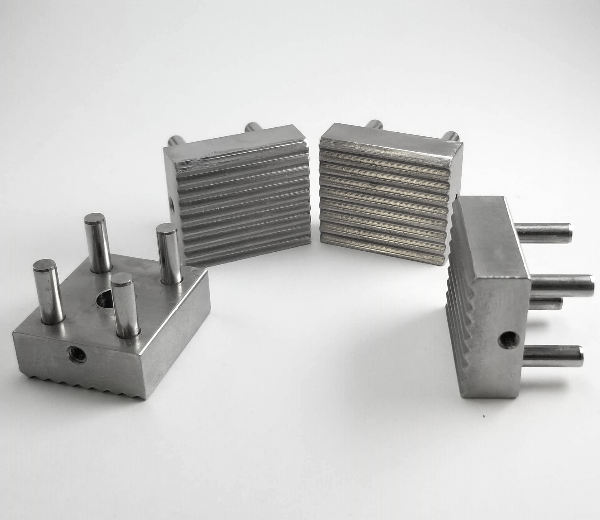
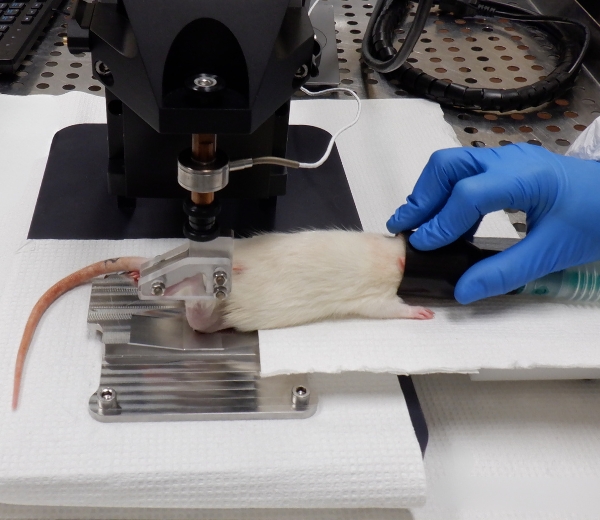
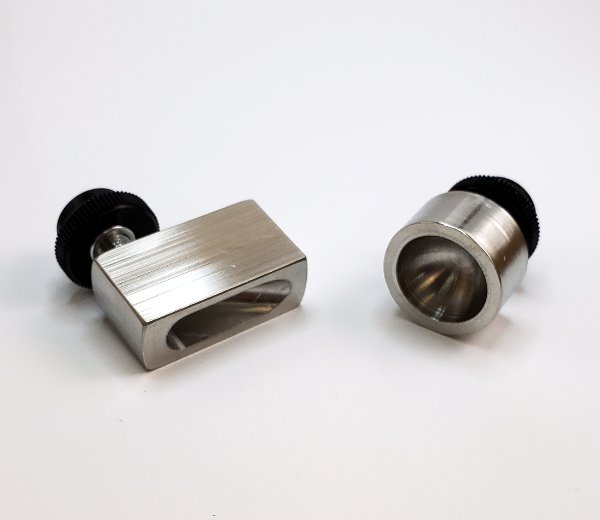
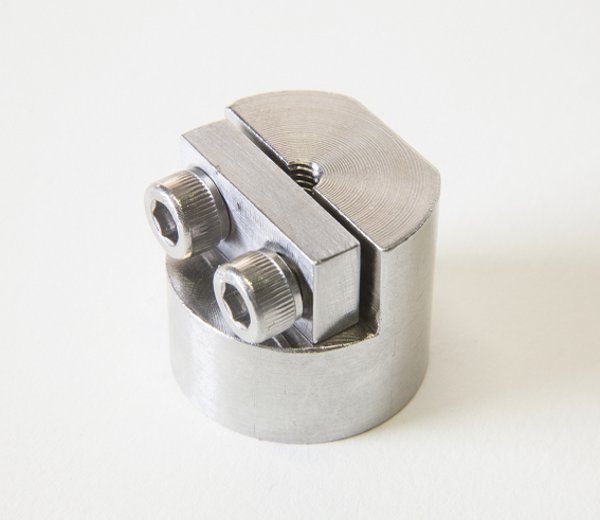
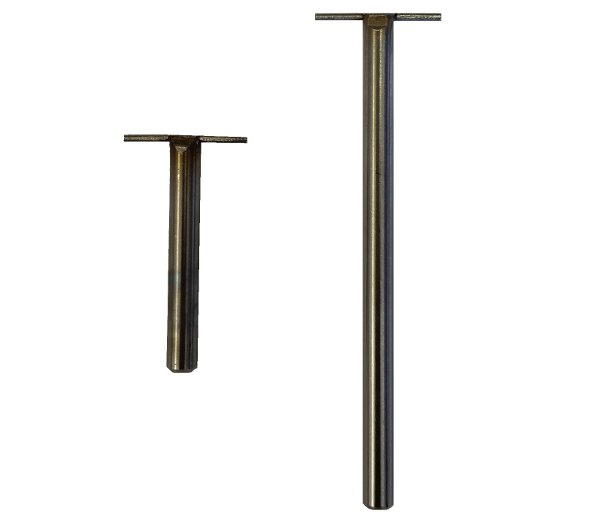
Two pair of grips used for tensile tests with a mounting plate allowing easier sample set up

SKU: MA090 Categories: ,

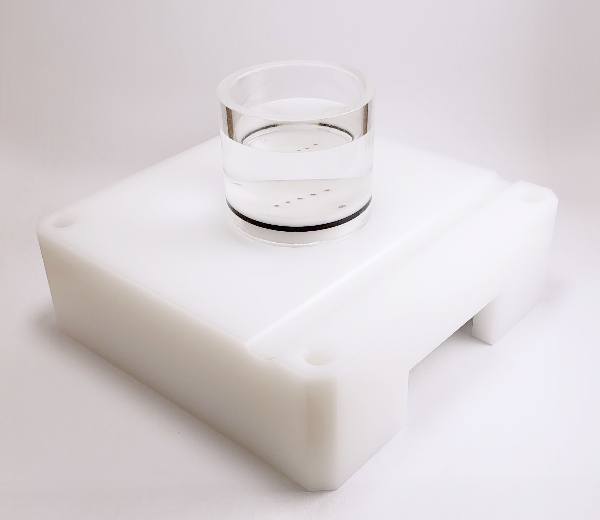
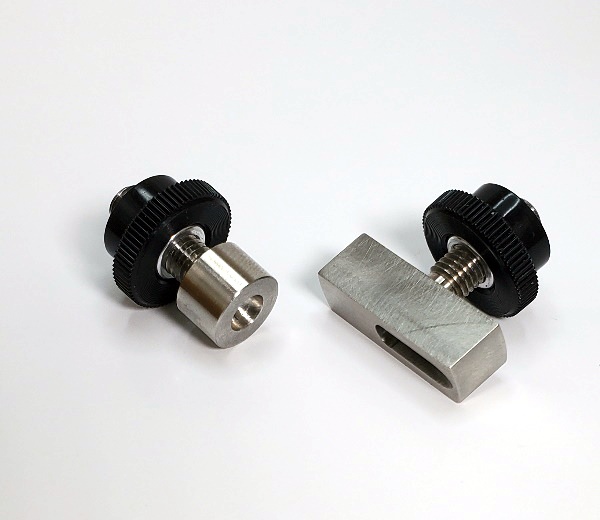
These grips were designed for tension testing of soft sheet material. Their C-shaped cavities, coupled with the screwed stainless steel bar, solidly lock the sample in the grip. This set includes 4 grips (2 sets of 2) and the mounting plate allowing for an easy fixing of the sample.

  • This accessory has been designed to facilitate cleaning and desinfection.
  • This part has a robust design and will keep its integrity for years
  • Designed to be used in contact with physiological saline solution
  • Easy to assemble and mount on the tester
Material

Stainless Steel 316L

Width

25 mm (max griping sample width)

Diameter

1/4 in (6.35 mm) Rod

Spacing

21.4 to 91.4 mm (ajustable step of 10 mm) (sample length between grips)

Thickness

8 mm (max sample)

Lower Attachment

1/4-28 male thread

Upper Attachment

1/4-28 male thread

Test configurations (4)

Test configuration

Tear

FAQ

How does the "Sinusoid" model works?

This feature is used to obtain the Frequency, Amplitude and Offset of a sinusoidal signal. A blue line displays the theoretical sinusoid with the Frequency, Amplitude and Offset obtained (Figure 1). The values of the Frequency, Amplitude and Offset are indicated in the "Results" field. The units vary according to the graph’s axes.

This feature can also be used for sinusoidal stimulus-response analysis. Sinusoidal stimulus shall be selected on the x-axis and the sinusoidal response on the y-axis. The Modulus is the ratio of the response Amplitude over the stimulus Amplitude. The Phase is the phase difference between the response and the stimulus. The Modulus’ is computed as the Modulus*Cos(Phase) and the Modulus” is computed as the Modulus*Sin(Phase). A blue line displays the theoretical sinusoidal stimulus-response with the Frequency, Modulus and Phase obtained (Figure 2). The values of the Modulus and Phase are indicated in the “Results” field. The units vary according to the graph’s axes.

One use for this feature would be to compute material properties by multiplying the Modulus obtained by the appropriate geometric factors. For example, the Young’s Modulus can be obtained during uniaxial compression or tension on cylindrical sample with t/pi*r2 as the geometric factor, t is the thickness and r is the radius of the sample.

Mach-1 Analysis – Sinusoid – Example for stimulus-response analysis

Mach-1 Analysis – Sinusoid – Example for signals analysis

Need Help Choosing an Accessory?

Talk to our team

Report a problem with this page

Your email is used only to follow up on this report.

Screenshots (optional)

Click this area and paste a screenshot, or drag files here. Up to 3 PNG, JPEG or WebP images; 5 MB per image. Hide confidential information first.

Please do not include passwords or customer information. Reports and screenshots are private.