(En anglais seulement) A currently unsatisfied need in arthritis and cartilage research is the ex vivo functional assessment of an entire articular cartilage surface both quantitatively and non-destructively. The objective of this study was to investigate the ability of a novel automated technique to characterize the mechanical properties of entire articular surfaces in indentation in order to rapidly discriminate between degenerated versus healthy articular cartilage.
Method
Sample
Complete articular surfaces from 8 human distal femurs were obtained from RTI Surgical, FL. Articular surfaces were attached to a testing chamber filled with PBS and equipped with a camera-registration system (1 mm registration resolution). A position grid was superimposed on the image of the sample (Image 2). Articular surfaces were visually graded using the ICRS system:
- ICRS 0 (visually normal, outside circled regions in Images 4 & 5)
- ICRS > 0 (visually abnormal, inside circled regions in Images 4 & 5)
Automated Indentation Mapping
- A spherical indenter (radius = 3 mm) for this new automated indentation technique.
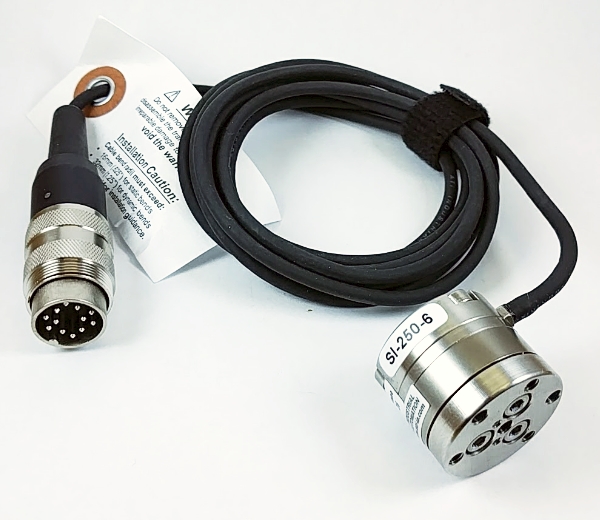
- A multiaxial load cell uses Fx, Fy and Fz to calculate the normal force.
- A 3-axis mechanical tester (Mach-1 v500css) uses 3 displacement components simultaneously to perform a perpendicular displacement based on the measured surface orientation.
- Steps performed at each position:
1) Measure the contact coordinates at a predefined position
2) Measure the contact coordinates of 4 surrounding positions
3) Calculate surface orientation using the contact coordinates
4) Perform perpendicular indentations and measure the normal force
Automated Thickness Mapping
- A needle probe replaces the spherical indenter.
- A load cell uses Fz to calculate the force (Image 3).
- Thickness measurements use a needle penetration technique.
- Mapping of cartilage vertical distance over the entire articular surface.
- Cartilage thickness was calculated using the surface orientation previously obtained.
Thickness = Vertical distance x cosine (surface orientation)
Instantaneous Modulus Calculation
The instantaneous modulus at each position was obtained by fitting the load-displacement curve (with corresponding thickness) to an elastic model in indentation.
Results
The mappings reveal patterns of thickness (Image 4) and instantaneous modulus (Image 5) that are spatially correlated and symmetric for right and left joints of the same donor. Using a one-way analysis of variance (ANOVA), a significant difference in thickness and instantaneous modulus distributions was found between the donors (p 0.1 for both). Values obtained for thickness are in agreement with previously reported data for human femoral cartilage.
Thickness mappings are more uniform than the instantaneous modulus mappings and the thickness patterns do not correlate with the visual assessment of abnormal cartilage (ICRS > 0) (Image 4). Instantaneous modulus, measured in indentation over the entire surface, identifies and quantifies the visually identified abnormal regions and shows degradation patterns that often extend the visual lesion boundaries (Image 5). These regions show much lower instantaneous modulus (between 0.2 and 3 MPa, blue-green regions in Image 5) than the average instantaneous modulus measured. Excluding sample preparation time, the acquisition of each pair of thickness and indentation mappings takes 1 minute/position of machine time and 30 minutes/pair of joints of data post-processing.
Conclusion
In contrast to what is usually required for traditional biomechanical testing (i.e. individual sample harvesting, visual orientation of the sample surface perpendicularly to compression axis, sample preservation causing possible mechanical alteration), this technique does not require interventions that are costly and time-consuming, thus considerably reducing sources of measurement error and allowing for high resolution mappings of the entire articular surface. The results of this study clearly demonstrate the capabilities of this novel automated indentation technique to rapidly, objectively and non-destructively map the biomechanical properties of full articular surfaces and to identify degenerated regions. This automated indentation mapping technique will be of great value in the identification of wear patterns in OA progression and in cartilage repair studies.
 Voir : Indentation 3D et épaisseur du cartilage