
Test configuration
Tooth brushing is the most important behavior in oral hygiene, allowing the removal of dental plaque and aiding in the prevention of oral diseases such as gingivitis and dental caries.
Tooth brushing is the most important behavior in oral hygiene, allowing the removal of dental plaque and aiding in the prevention of oral diseases such as gingivitis and dental caries. Tooth brushing studies are essential in the development of novel techniques for the removal of dental plaque. A multiaxial mechanical tester can be used to simulate the complex brushing actions with the goal of developing a controlled test bench for the evaluation of new brushes or toothpastes.


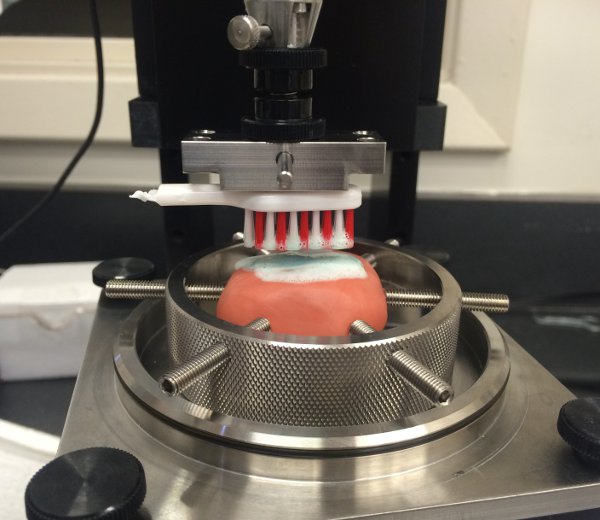
 Watch: Toothpaste testing in a brushing simulator
Tissue testing · 0:12
A demonstration of toothpaste testing in a tooth brushing simulator.
This feature is used to obtain the Frequency, Amplitude and Offset of a sinusoidal signal. A blue line displays the theoretical sinusoid with the Frequency, Amplitude and Offset obtained (Figure 1). The values of the Frequency, Amplitude and Offset are indicated in the "Results" field. The units vary according to the graph’s axes.
This feature can also be used for sinusoidal stimulus-response analysis. Sinusoidal stimulus shall be selected on the x-axis and the sinusoidal response on the y-axis. The Modulus is the ratio of the response Amplitude over the stimulus Amplitude. The Phase is the phase difference between the response and the stimulus. The Modulus’ is computed as the Modulus*Cos(Phase) and the Modulus” is computed as the Modulus*Sin(Phase). A blue line displays the theoretical sinusoidal stimulus-response with the Frequency, Modulus and Phase obtained (Figure 2). The values of the Modulus and Phase are indicated in the “Results” field. The units vary according to the graph’s axes.
One use for this feature would be to compute material properties by multiplying the Modulus obtained by the appropriate geometric factors. For example, the Young’s Modulus can be obtained during uniaxial compression or tension on cylindrical sample with t/pi*r2 as the geometric factor, t is the thickness and r is the radius of the sample.
Mach-1 Analysis – Sinusoid – Example for stimulus-response analysis