Characterization of Electromechanical Properties of Connective Tissues - Part 1 - Articular Cartilage
In this case study, the Mach-1 mechanical tester was used to determine the electromechanical properties of two connective tissues: the cartilage and the meniscus. Since tissue stiffness and compression-generated electric fields, or streaming potentials, are sensitive to the biochemical content of the tissue, the tester was coupled with an array of electrodes that can precisely measure these electric signals. The objective of this study was to establish links between biochemical composition and electromechanical properties (stiffness and streaming potentials) of normal and degenerated connective tissues. The first part of the study focuses on articular cartilage.
Since the articular cartilage extracellular matrix is primarily composed of negatively charged proteoglycans entrapped in a collagen network, there is an excess of mobile positive charges in the fluid. Compression of the cartilage produces streaming potentials via the separation of positively charged mobile ions relative to the fixed negatively charged proteoglycans.
Matched pairs of bovine cartilage/bone disks (3 mm in diameter) were cultured with and without a degradation agent (interleukin-1 or IL-1) for 11 days.
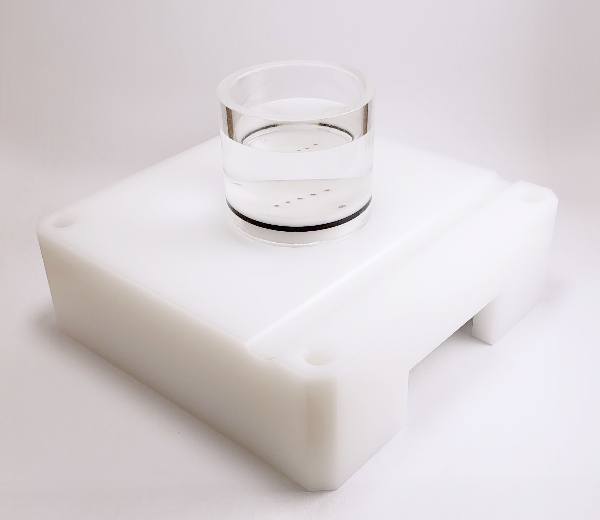
Electromechanical properties of the cartilage were evaluated by incorporating an array of electrodes into a testing chamber mounted on the Mach-1. The Mach-1 is designed for various testing protocols including stress relaxation, sinusoidal displacement and creep in different configurations (confined and unconfined compressions, tension, indentation and bending). In this study, streaming potentials across the tissue surface are measured in unconfined compression geometry with a linear array of 8 platinum electrodes of 50 um diameter separated by 300 um. Electrodes 1 to 6 covered the 1.5 mm cartilage disk radius, and electrodes 7 and 8 were external to the cartilage in the bath. The testing chamber was filled with physiological saline solution. A static compression offset of 100 um was applied in a sequence of small step compressions of 20 um at 2 um/s. Dynamic sinusoidal tests were performed at frequencies of 1, 0.1 and 0.01 Hz with displacement amplitudes of 8, 4 and 2 um. The streaming potential radial profile was constructed by the addition of each channel in the complex domain. Proteoglycan or glycosaminoglycan (GAG) content in the disk and content lost to the media during the culture was measured with the dimethylmethylene blue dye and spectrophotometry.
Figure 3 shows the GAG content in cartilage disks during the culture. The IL-1 treated disks lost 10, 20, 65 and 75% of their GAG content after 1, 4, 7 and 11 days of culture respectively. The Mach-1 is easy to use and its modular software permits a direct and rapid analysis of the dynamic sinusoidal test results. Figure 4 shows that dynamic stiffness was 3 times lower for the IL-1 treated disks compared to control after 11 days of culture.
The analysis of the stress relaxation test results showed that, at the end of the culture, the static stiffness was 4 times lower for degraded disks compared to control (0.3 MPa). Figure 5 shows the streaming potential profiles after 11 days of culture for normal and degraded cartilage. We observed that the profile potential gradient at the periphery for the IL-1 treated explants was reduced by half compared to control disks only one day after the beginning of the culture. The potential profile amplitude at the center of the disk was significantly lower for degraded disks compared to control explants after 7 days of culture.
The Mach-1 mechanical tester coupled with an array of electrodes can precisely determine the electromechanical properties of a large range of normal and degraded connective tissues.
Figures

Figure 1 — Show caption
Cartilage specimen mounted in the electromechanical testing chamber.

Figure 2 — Show caption
Schematic of simultaneous mechanical loading and streaming potential measurements in cartilage.

Figure 3 — Show caption
GAG content over time in control and IL-1-treated cartilage discs.

Figure 4 — Show caption
Dynamic stiffness versus frequency at day 11 in control and IL-1-treated cartilage.

Figure 5 — Show caption
Streaming potential amplitude versus radial position at day 11 in control and IL-1-treated cartilage.
Products (1)
Accessories (9)





Test configurations (2)

Test configuration
Unconfined Compression

Test configuration